

IndiView Chart of the Week: The Fed and Inflation
Not surprisingly, the U.S. Federal Reserve chose to keep rates steady at its most recent meeting. If you were following CME Fed Fund futures, this was a near certainty.
So, with slowing growth and a President openly favoring rate cuts, why hasn’t the Fed moved?
A simple answer: inflation.
While inflation has come down from its 2022 highs, it remains above the Fed’s target—and recent data suggests progress has slowed. Across the most closely watched measures (headline and core CPI and PCE), there is not yet a clear signal that inflation is fully under control.
For this week’s Chart of the Week, we look at a long-term relationship. The chart below spans January 1960 to February 2026. The blue line represents the Effective Fed Funds Rate (the Fed’s primary policy tool), and the gray line shows the year-over-year change in CPI (headline, including food and energy).
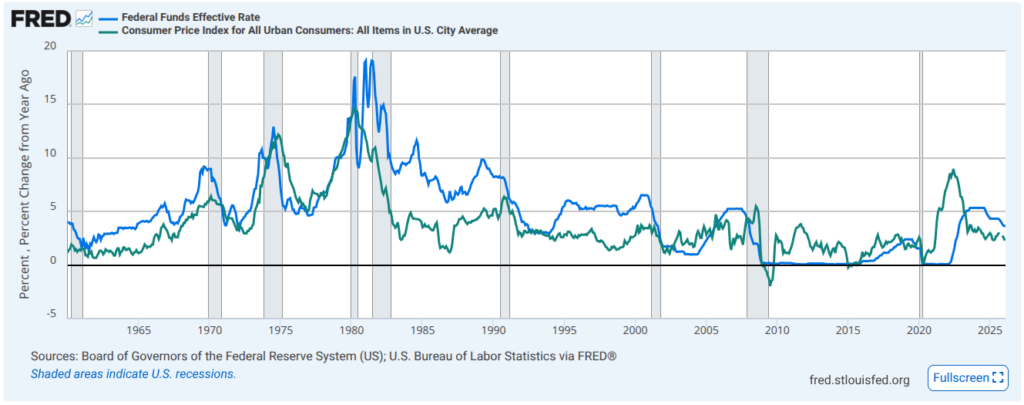
As you can see, Fed Funds and inflation tend to move together over time. This aligns with the Fed’s dual mandate: full employment and price stability.
It’s helpful to think about this relationship across distinct periods:
1960–1980
Inflation and Fed policy largely moved in tandem, even as inflation surged due to oil shocks. Notably, this was one of the few periods where policy tightening overlapped with recessionary environments—something that feels almost unthinkable today.
1980–2000
The “18% mortgage” era. During much of this period, the Fed Funds Rate exceeded inflation. The inflation shock of the early 1980s left a lasting imprint on both policymakers and consumers. While those experiences still resonate with the boomer generation, rates above 7% now feel extreme to many Gen X, Millennials, and Gen Z borrowers.
2000–2009
Bookended by the dot-com collapse and the Global Financial Crisis. Headline inflation saw occasional spikes, largely driven by energy and food—particularly during the early stages of the 2008–2009 recession.
2009–2022
The era of ZIRP (Zero Interest Rate Policy). This period may look increasingly unusual in hindsight. Globally, investors were at times paying for the privilege of holding bonds—an environment that may be difficult to replicate-or even comprehend-in the future.
2022–Present
Still being written. After the first sustained inflation surge in nearly 40 years, the key question is how aggressively the Fed is willing to use interest rates going forward—especially after having recently held them at zero.
Bottom Line
The Fed takes its dual mandate seriously. At current levels, holding rates steady remains the most likely near-term path.
Potential catalysts for change include:
- Rate cuts due to economic deterioration (possible)
- Further hikes if inflation re-accelerates (less likely)
- Policy shifts under new Fed leadership facing political pressure (plausible)
It’s also important to remember: interest rates are set by the FOMC—a committee. While the Chair is influential, decisions are not made unilaterally.
If inflation remains above target, expect continued tension between economic growth, price stability, and political will—particularly in the second half of the year.
This content, which contains security-related opinions and/or information, is provided for informational purposes only and should not be relied upon in any manner as professional advice, or an endorsement of any practices, products or services. There can be no guarantees or assurances that the views expressed here will be applicable for any particular facts or circumstances, and should not be relied upon in any manner. You should consult your own advisers as to legal, business, tax, and other related matters concerning any investment.
The commentary in this “post” (including any related blog, podcasts, videos, and social media) reflects the personal opinions, viewpoints, and analyses of IndiWealth employees providing such comments, and should not be regarded the views of IndiWealth LLC. or its respective affiliates or as a description of advisory services provided by IndiWealth or performance returns of any IndiWealth client.
References to any securities or digital assets, or performance data, are for illustrative purposes only and do not constitute an investment recommendation or offer to provide investment advisory services. Charts and graphs provided within are for informational purposes solely and should not be relied upon when making any investment decision. Past performance is not indicative of future results. The content speaks only as of the date indicated. Any projections, estimates, forecasts, targets, prospects, and/or opinions expressed in these materials are subject to change without notice and may differ or be contrary to opinions expressed by others.
Investments in securities involve the risk of loss.