

IndiView Chart of the Week: Top 10 Stocks Over Time
For much of this year, we’ve discussed the rising concentration of the S&P 500 among its largest companies. As of 12/16/25, the top 10 companies by market capitalization represent over 40% of the index—one of the highest concentration levels in history.
This week’s chart reflects that reality, but it also highlights something equally important: companies at the top shouldn’t get too comfortable staying there.
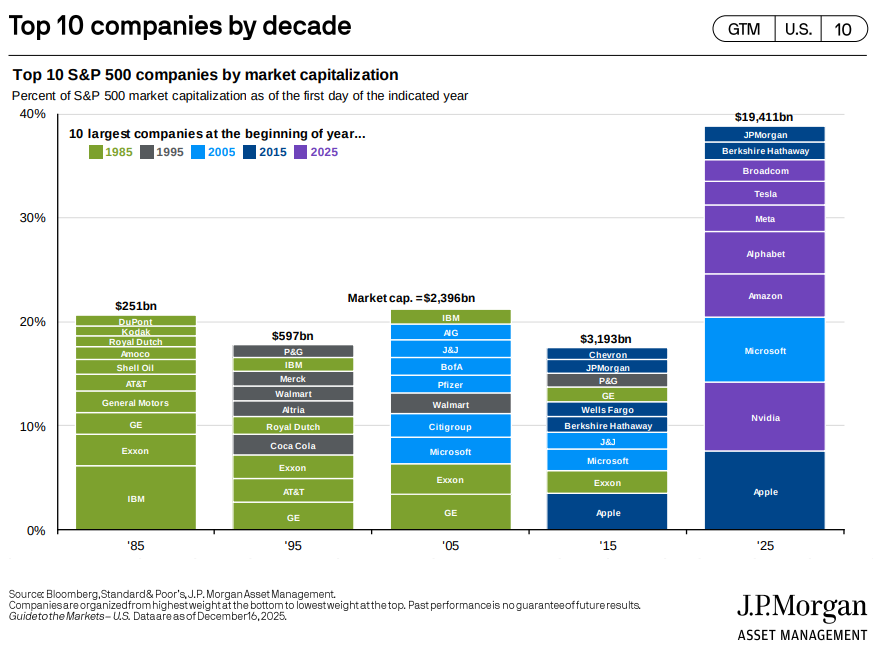
The chart below, from JPMorgan, shows the top S&P 500 companies as of the first trading day in 1985, 1995, 2005, 2015, and 2025.
Observation #1: Concentration Has Reached an Extreme
Today’s top four, Apple, Nvidia, Microsoft, and Amazon, represent a larger share of the S&P 500 than the entire top 10 did in prior decades. Overall, today’s top-10 concentration is nearly double the next-highest level, which occurred in 2005.
Observation #2: Leadership Turns Over Consistently
Looking at overlap from decade to decade:
- 1995: Only four companies remained from 1985 (Exxon, AT&T, GE, Royal Dutch)
- 2005: Four remained again, but only three carried over from 1985 (Royal Dutch fell out)
- 2015: Four remained from 2005, with Procter & Gamble returning after a hiatus
- 2025: Four remained from 2015, but none from 1985 are still in the top 10
History is clear: Kings don’t always stay kings. Many former leaders still exist and remain large companies, but their dominance has been replaced as technology, behavior, and spending patterns evolve.
Observation #3: Sector Leadership Tells a Story for Each Era
Each decade reflects the prevailing economic theme of its time:
- 1985: Dominated by oil (Exxon, Shell, Amoco, Royal Dutch)
- 1995: The rise of consumer brands and retail scale (Walmart, P&G, Coca-Cola, Altria)
- 2005: Post dot-com dominance of financials (AIG, Bank of America, Citigroup) – this was short-lived after 2008
- 2015: Apple, nearly bankrupt in 1997, emerges as the largest company
- 2025: Tech and AI dominate, with JPMorgan and Berkshire the only non-tech exceptions
Looking Ahead: What Might 2035 Hold?
A natural question is whether today’s extreme concentration persists or whether the S&P 500 reverts toward historical diversification. Also, will today’s leaders still dominate a decade from now?
For a little fun (and with full understanding that most will be wrong – and certainly not investment advice), here are some guesses that we have for the decade ahead:
- The historical pattern of fewer than five repeat members likely holds again
- Breakups, whether forced or voluntary, could occur (Alphabet, Amazon, Microsoft, or Apple are candidates)
- One or more leaders may face obsolescence or major share loss (Nvidia, Tesla, Broadcom are my potentials here)
- Berkshire Hathaway presents a unique test: can post-Buffett leadership sustain its model and size?
- We expect greater dispersion and less concentration than today
- New entrants will appear—though true “out of nowhere” top-10 companies are rare
- Our guesses for who could make it (likely very wrong): OpenAI, Waymo, or Costco
Closing Thoughts
Market leadership tends to evolve as technology, consumer behavior, and capital flows change. The lesson from history isn’t that today’s leaders will fail—but that tomorrow’s market will almost certainly look different than it does today.
This content, which contains security-related opinions and/or information, is provided for informational purposes only and should not be relied upon in any manner as professional advice, or an endorsement of any practices, products or services. There can be no guarantees or assurances that the views expressed here will be applicable for any particular facts or circumstances, and should not be relied upon in any manner. You should consult your own advisers as to legal, business, tax, and other related matters concerning any investment.
The commentary in this “post” (including any related blog, podcasts, videos, and social media) reflects the personal opinions, viewpoints, and analyses of IndiWealth employees providing such comments, and should not be regarded the views of IndiWealth LLC. or its respective affiliates or as a description of advisory services provided by IndiWealth or performance returns of any IndiWealth client.
References to any securities or digital assets, or performance data, are for illustrative purposes only and do not constitute an investment recommendation or offer to provide investment advisory services. Charts and graphs provided within are for informational purposes solely and should not be relied upon when making any investment decision. Past performance is not indicative of future results. The content speaks only as of the date indicated. Any projections, estimates, forecasts, targets, prospects, and/or opinions expressed in these materials are subject to change without notice and may differ or be contrary to opinions expressed by others.
Investments in securities involve the risk of loss.