

IndiView Chart of the Week: Tariffs – Yes, You Are Paying
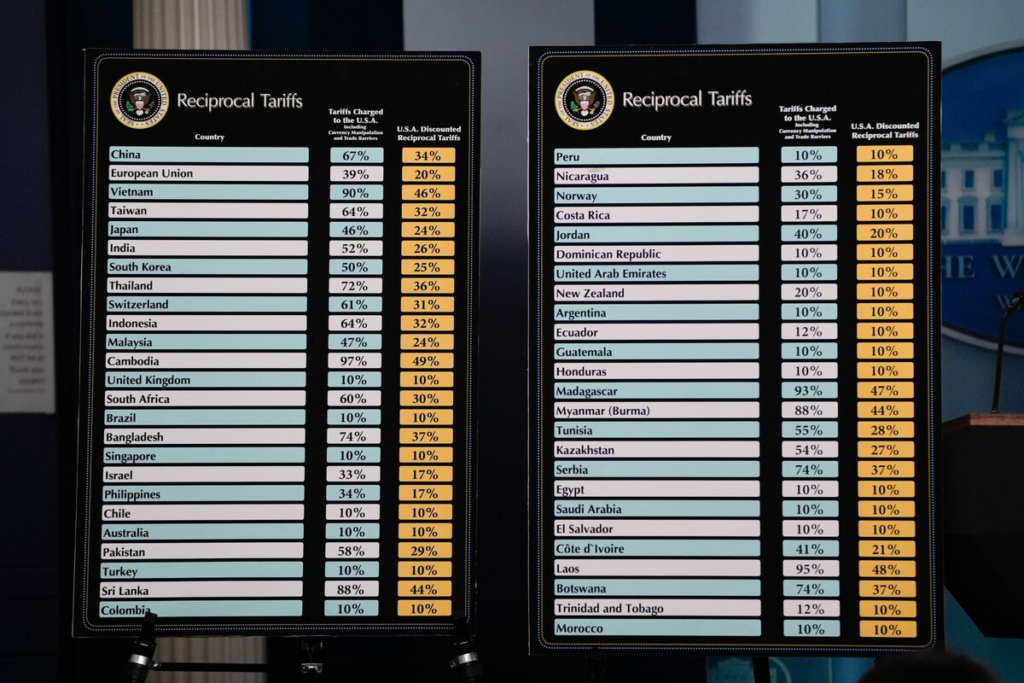
We are approaching the one-year anniversary of “Liberation Day,” when President Trump unveiled a poster board outlining tariff rates for various trading partners.
Markets initially reacted poorly to the announcement, but over the past year equities have rebounded and returned to all-time highs before retracing recently.
Despite frequent changes to tariff rates and exemptions, a year of data now allows us to draw several conclusions about who ultimately bears the cost.
The evidence from the past year points to a clear conclusion: tariffs primarily function as a domestic (and regressive) tax, with most of the cost ultimately borne by U.S. businesses and consumers.
US firms and consumers bear the bulk of the tariff costs
A November 2025 study from the New York Federal Reserve estimates that roughly 90% of the economic burden from tariffs is borne by U.S. firms and consumers. The analysis includes both the most recent tariffs and those implemented during President Trump’s first term (2018–2019).
This contradicts the administration’s argument that foreign exporters would absorb the tariffs through lower prices. The evidence instead shows that most of the cost ultimately flows through to U.S. businesses and consumers.
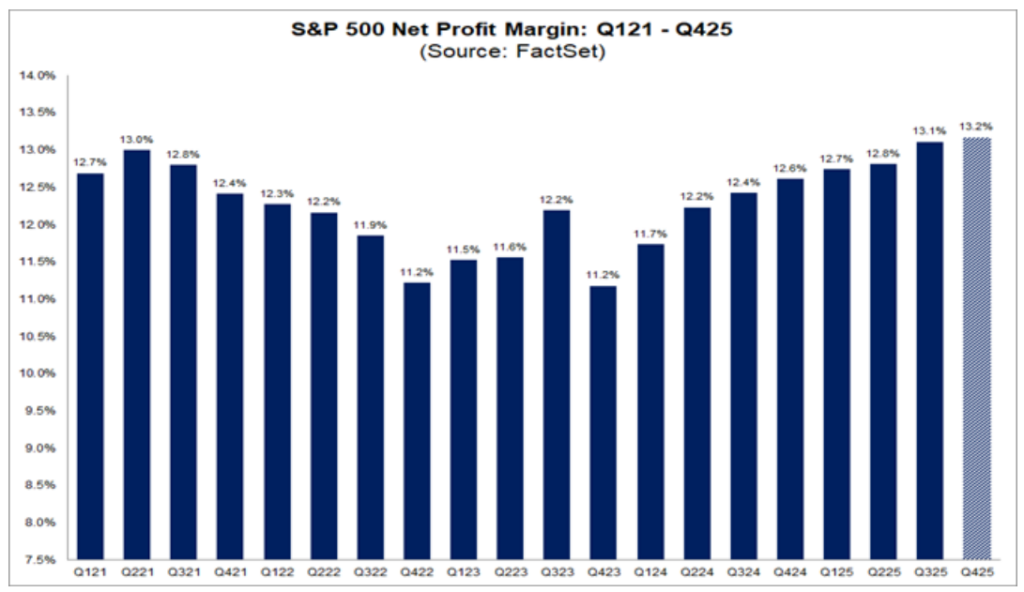
Tariffs have not hurt S&P 500 profit margins (in aggregate)
Even though U.S. companies are absorbing much of the tariff cost, S&P 500 profit margins have continued to rise, reaching higher levels throughout 2025 according to FactSet data.
Several factors explain why margins have remained resilient:
- Companies successfully passed on costs to consumers (more on this later)
- Efficiency and automation, including artificial intelligence productivity, have offset tariff costs
- Supply chain management is more adaptable and can pivot from higher tariff regions
- Larger S&P 500 companies are more service-based and less affected by goods inflation
Tariffs have not caused an inflation spike
The chart below shows year-over-year CPI inflation dating back to 1970. While prices remain elevated compared with the pre-COVID period, inflation has not accelerated over the past year despite higher tariffs.
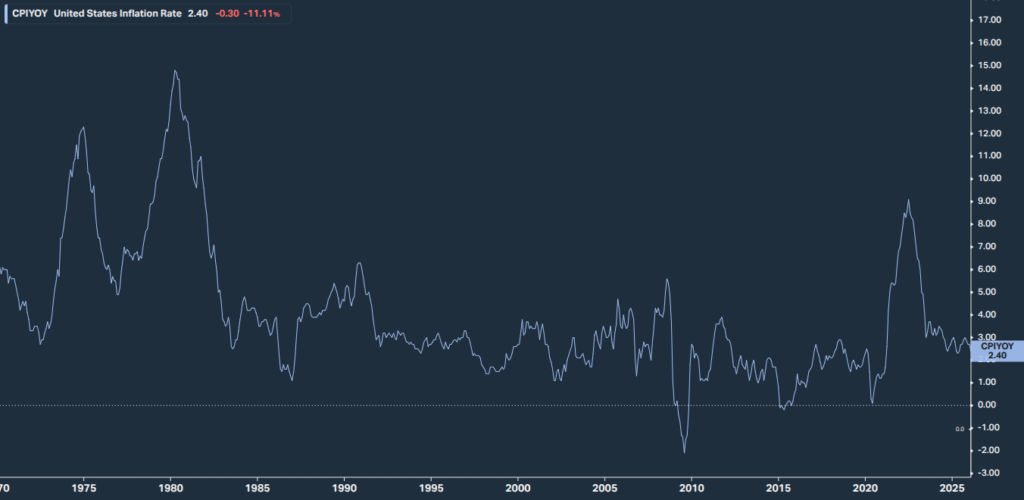
This doesn’t mean, however, that tariffs have not influenced prices. New York Fed President John Williams has noted that tariffs have raised the price of imported goods and slowed progress toward the Federal Reserve’s 2% inflation target.
Tariffs are a regressive tax
A regressive tax, according to Britannica, places a proportionally larger burden on lower-income households. Per the Yale Budget Lab, tariffs function this way because lower-income households spend a larger share of their income on goods.
In conjunction with tariffs, the One Big Beautiful Bill Act was passed in 2025 which will lead to tax changes for much of the population. According to the Tax Foundation, a non-partisan non-profit entity, the level of benefit by income level (below) is lowest among the bottom 20% of earners while higher earners receive more of the benefit.
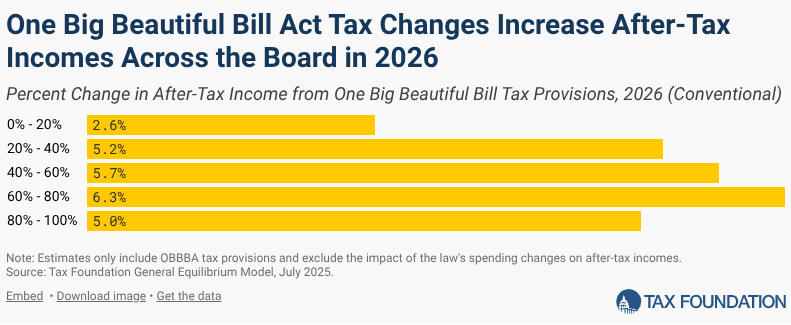
When tariffs are combined with the OBBBA tax changes, lower-income households receive less of the tax benefit while bearing a greater share of the tariff burden. In our view, this dynamic contributes to the affordability challenges facing middle- and lower-income households. It may also reinforce the “K-shaped economy,” where higher-income households capture a larger share of economic gains.
Portfolio actions
From a portfolio perspective, we have long held the stance that Washington should not be a primary driver of long-term asset allocation decisions. We continue to believe that is the case. The variables are too unknown and aligning portfolios with politics often leads to short-term decisions that undermine patience and discipline.
For asset owners, however, considering the effects of inflation on portfolios is essential. Inflation was largely controlled and predictable for much of the 1990 – 2020 time period before COVID-based stimulus and lack of ability to produce goods created the highest levels of inflation in 40 years. 2022 was a sharp reminder that inflation spikes (and the rate changes to control it) can create negative consequences even for relatively safe bonds. If we are in a period of greater inflation volatility, investors need to assess what that means for their objectives and their willingness to accept risk.
This is why time-horizon-based investment strategies can be effective. Short-term strategies allow for risk mitigation and safety because of the near term need for the assets while long-term strategies should offer growth to exceed the effects of inflation at the expense of greater short term volatility. Understanding the time horizon of your assets allows you to set an appropriate level of risk for each segment of the portfolio.
Sources:
- https://www.nytimes.com/2026/02/12/business/economy/americans-pay-tariffs-trump-fed.html
- https://www.nytimes.com/2026/01/03/business/economy/trump-tariffs-prices-impact.html
- https://www.cnbc.com/2026/03/03/new-york-feds-williams-says-tariff-burden-falls-overwhelmingly-on-us-businesses-and-consumers.html
- https://budgetlab.yale.edu/research/state-us-tariffs-scotus-ruling-update
- https://taxfoundation.org/data/all/federal/tax-calculator-obbba/
- Koyfin.com (CPI data)
This content, which contains security-related opinions and/or information, is provided for informational purposes only and should not be relied upon in any manner as professional advice, or an endorsement of any practices, products or services. There can be no guarantees or assurances that the views expressed here will be applicable for any particular facts or circumstances, and should not be relied upon in any manner. You should consult your own advisers as to legal, business, tax, and other related matters concerning any investment.
The commentary in this “post” (including any related blog, podcasts, videos, and social media) reflects the personal opinions, viewpoints, and analyses of IndiWealth employees providing such comments, and should not be regarded the views of IndiWealth LLC. or its respective affiliates or as a description of advisory services provided by IndiWealth or performance returns of any IndiWealth client.
References to any securities or digital assets, or performance data, are for illustrative purposes only and do not constitute an investment recommendation or offer to provide investment advisory services. Charts and graphs provided within are for informational purposes solely and should not be relied upon when making any investment decision. Past performance is not indicative of future results. The content speaks only as of the date indicated. Any projections, estimates, forecasts, targets, prospects, and/or opinions expressed in these materials are subject to change without notice and may differ or be contrary to opinions expressed by others.
Investments in securities involve the risk of loss.