

IndiView Chart of the Week: Big Numbers Are Meant to Scare You
Over the past month, I’ve noticed several headlines like these popping up in major outlets:
- “Stock market margin debt tops $1 trillion”
- “Credit card debt reaches $1.21 trillion — in line with last year’s all-time high”
Those absolute numbers are eye-catching — and that’s the point. Large numbers are meant to grab attention. But if we want to understand whether they signal real risk, we need to add context. The human brain is powerful, but it struggles to make sense of very large magnitudes.
Consider this example:
- The distance from Earth to the Sun is 93 million miles — huge in its own right.
- The distance from Earth to the next closest star (Proxima Centauri) is 25.2 trillion miles. Clearly bigger… but how much bigger?
Well, you’d have to make 270,000 trips to the Sun to cover the distance to Proxima Centauri. Same universe, but vastly different scale.
Margin Debt: The Headlines vs. Reality
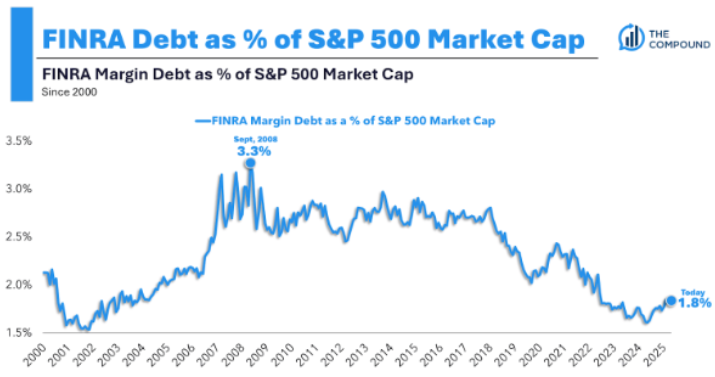
Take the “$1 trillion in margin debt” headline. The figure is technically accurate, but it misses context. In her newsletter, Callie Cox (worth reading — link below) shared margin debt as a percentage of S&P 500 market cap.
Viewed that way, margin debt is well below levels seen in the past 25 years, and far under the peaks of 2005–2007. The absolute number sounds scary; the relative measure suggests leverage in the system is manageable.
Credit Card Debt: Big Number, Smaller Bite
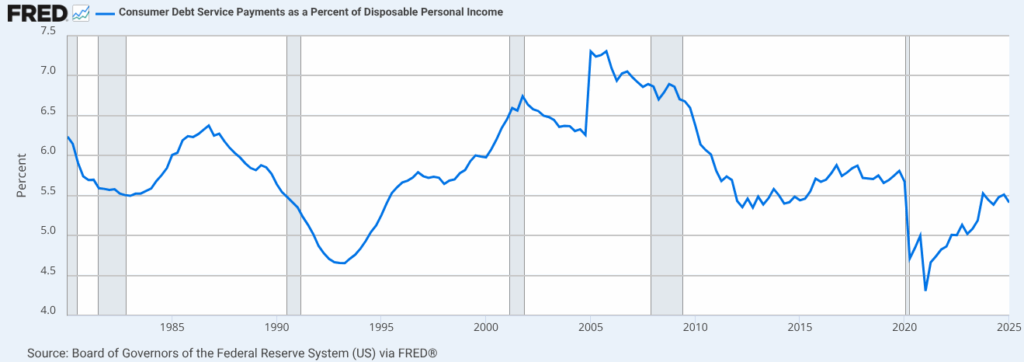
The $1.21 trillion in credit card debt comes from the New York Fed’s most recent quarterly household debt report. Again, the number is large — but it’s more useful to compare it to income to add context to that size.
The St. Louis Fed (FRED) tracks consumer debt (total household debt minus mortgages) as a share of disposable personal income. That series shows debt rising off the 45-year low set in 2021, but still below long-term averages — and far beneath the 2005–2007 highs.
U.S. Government Debt: Numbers and Context Align
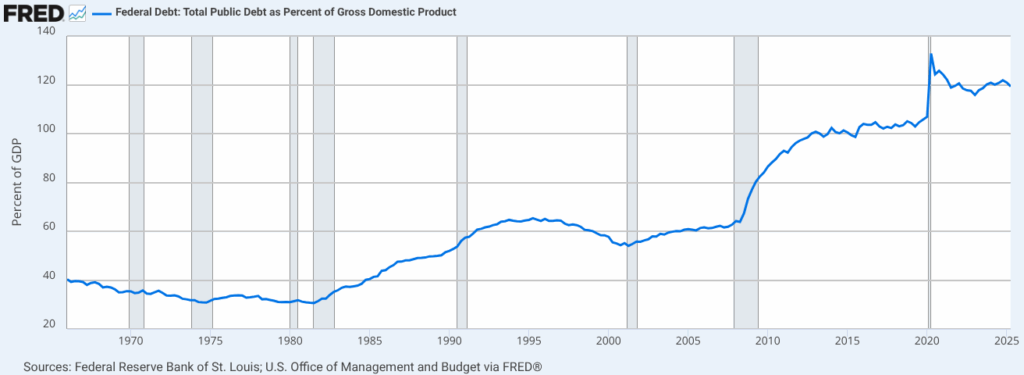
Here’s one case where both the absolute number and the context are concerning. As of September 10, 2025, U.S. government debt exceeds $37 trillion. To contextualize, compare debt to GDP.
On that measure, today’s ratio is well above historical averages and near the all-time high set during the COVID years of 2020. In this instance, the raw number and the relative measure both point to real strain. While no one knows the exact breaking point for debt-to-GDP levels, what is clear is that in the post-COVID era the U.S. government remains more leveraged than at any point in the previous 50 years.
The Takeaway
Big numbers in headlines are designed to shock — but without context, they don’t tell the full story. When you put them into perspective, margin debt and consumer debt look less threatening than the headlines imply, while government debt stands out as a higher level of concern.
Headlines grab attention. Analysis requires context. At IndiWealth, our goal is to move beyond the headlines and provide the context investors need to make informed decisions. You can find more insights at indiwealthmanagement.com.
Sources
This content, which contains security-related opinions and/or information, is provided for informational purposes only and should not be relied upon in any manner as professional advice, or an endorsement of any practices, products or services. There can be no guarantees or assurances that the views expressed here will be applicable for any particular facts or circumstances, and should not be relied upon in any manner. You should consult your own advisers as to legal, business, tax, and other related matters concerning any investment.
The commentary in this “post” (including any related blog, podcasts, videos, and social media) reflects the personal opinions, viewpoints, and analyses of IndiWealth employees providing such comments, and should not be regarded the views of IndiWealth LLC. or its respective affiliates or as a description of advisory services provided by IndiWealth or performance returns of any IndiWealth client.
References to any securities or digital assets, or performance data, are for illustrative purposes only and do not constitute an investment recommendation or offer to provide investment advisory services. Charts and graphs provided within are for informational purposes solely and should not be relied upon when making any investment decision. Past performance is not indicative of future results. The content speaks only as of the date indicated. Any projections, estimates, forecasts, targets, prospects, and/or opinions expressed in these materials are subject to change without notice and may differ or be contrary to opinions expressed by others.
Investments in securities involve the risk of loss.