

IndiView: Do We Need New Leading Indicators?
For many years, economists and market participants have looked to leading economic indicators to get a sense of where the economy is headed next. The question I have is whether the indicators we have relied on for decades are still as useful in the current economy as they once were.
Do they still provide valuable signals around growth trends, or are some of them past their prime as reliable recession indicators?
As a starting point, we can use The Conference Board’s Leading Economic Index, which includes:
- Average weekly hours in manufacturing
- Average weekly initial claims for unemployment insurance
- Manufacturers’ new orders for consumer goods and materials
- ISM New Orders Index
- Manufacturers’ new orders for nondefense capital goods excluding aircraft
- Building permits for new private housing units
- S&P 500 Index of Stock Prices
- Leading Credit Index
- Interest rate spread between the 10-year Treasury and federal funds rate
- Average consumer expectations for business conditions
On their face, these all make sense. If hours, orders, and permits are rising, that generally points to improving business activity. If jobless claims are rising, that can suggest labor market weakness. The yield curve has also been one of the most watched recession signals, especially when short-term rates move above long-term rates. And the S&P 500 is generally considered a forward-looking measure of business expectations rather than a simple reflection of current conditions.
But recent history raises some questions.
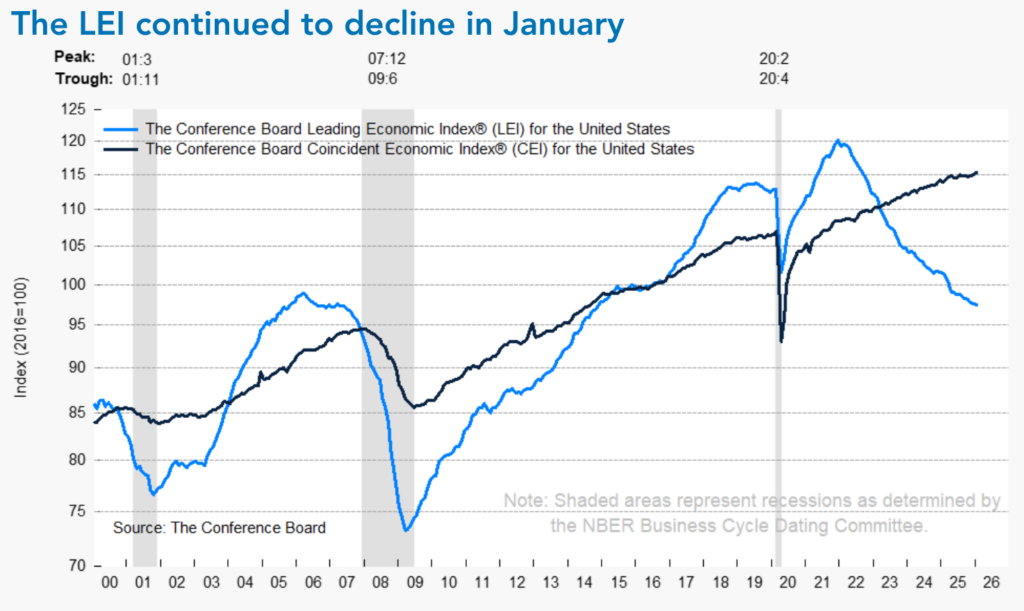
The first chart shows leading indicators versus coincident indicators. The latest data available in the chart is January 2026 because of delays tied to the federal government shutdown. The data shows that leading indicators have fallen sharply since 2022, with a decline that looks significant when compared to prior recessionary periods. At the same time, coincident indicators have continued to rise.
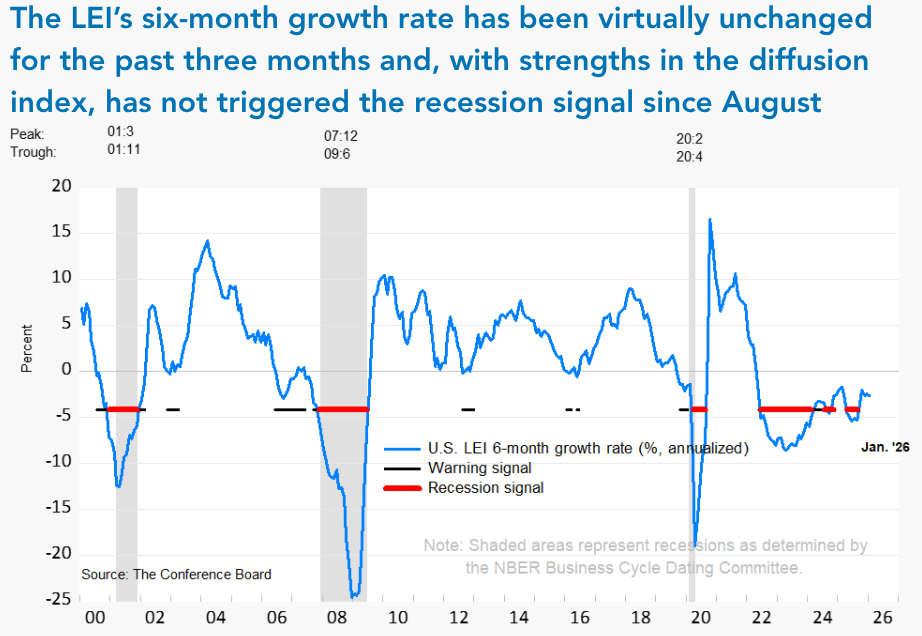
The second chart, also from The Conference Board, shows the six-month trend in leading indicators and the periods where the model produced a “recession signal.” The important takeaway is that the LEI spent an extended period flashing recession risk from 2022 through 2025, but the recession never arrived.
So why might the LEI be telling a less complete story than it has in the past?
First, the index still has a meaningful manufacturing bias. Manufacturing matters, but the U.S. economy is far more service-oriented than it used to be. Consumer spending alone now represents roughly two-thirds of GDP, and a manufacturing slowdown does not necessarily create the same economy-wide disruption it might have in prior decades.
Second, the S&P 500 itself has changed. The index is now highly concentrated, with the top 10 companies representing roughly 40% of total index weight. Many of those companies are tied to technology, artificial intelligence, cloud infrastructure, and digital advertising. That does not make the S&P 500 irrelevant, but it does mean that what drives the index may not always reflect the same thing as broad economic activity.
Third, the yield curve has been less useful this cycle. Historically, an inverted yield curve has been one of the better-known recession indicators. But from 2022 through 2024, the curve was inverted for an extended period, and the economy did not fall into recession. That does not mean the yield curve no longer matters. It does mean we should be careful about treating it as a stand-alone signal.
There are other explanations as well, but the broader point is clear: using the LEI as a recession signal has not worked especially well in the 2020s.
So what are we watching instead?
One is JOLTS, especially the quit rate. Employment itself is usually more coincident or lagging, but quits can tell us something about worker confidence. When people are comfortable leaving jobs, it usually suggests they believe other opportunities are available. When they stop quitting, it can be an early sign that workers are becoming more cautious.
Another is consumer credit and spending data. Because the consumer is such a large part of the U.S. economy, credit card spending, delinquency trends, and income-based spending patterns can provide useful clues. Right now, the picture looks split: higher-income consumers remain in decent shape, while lower-income consumers appear more pressured.
The third is semiconductor data. This is not my original idea — Josh Brown is the first person I heard discuss it publicly — but I think it makes sense. Semiconductors are embedded across a wide range of goods and technologies. Looking at which types of chips are seeing demand — memory, industrial, AI-related, consumer electronics — can provide a useful read on where economic strength or weakness is developing.
None of these indicators are perfect. There is no single data point that tells the whole story. But in a changing economy, I think these measures may do a better job identifying economic inflection points than relying too heavily on the traditional LEI framework.
As of today, I would describe these newer indicators as resilient in labor, bifurcated in consumer credit, and bullish in semiconductors due to continued AI-related demand. If those are the indicators we are watching, they do not suggest a recession is imminent. They suggest an economy that is uneven, changing, and harder to read using the old playbook.
Source for LEI data: https://www.conference-board.org/topics/us-leading-indicators/
This content, which contains security-related opinions and/or information, is provided for informational purposes only and should not be relied upon in any manner as professional advice, or an endorsement of any practices, products or services. There can be no guarantees or assurances that the views expressed here will be applicable for any particular facts or circumstances, and should not be relied upon in any manner. You should consult your own advisers as to legal, business, tax, and other related matters concerning any investment.
The commentary in this “post” (including any related blog, podcasts, videos, and social media) reflects the personal opinions, viewpoints, and analyses of IndiWealth employees providing such comments, and should not be regarded the views of IndiWealth LLC. or its respective affiliates or as a description of advisory services provided by IndiWealth or performance returns of any IndiWealth client.
References to any securities or digital assets, or performance data, are for illustrative purposes only and do not constitute an investment recommendation or offer to provide investment advisory services. Charts and graphs provided within are for informational purposes solely and should not be relied upon when making any investment decision. Past performance is not indicative of future results. The content speaks only as of the date indicated. Any projections, estimates, forecasts, targets, prospects, and/or opinions expressed in these materials are subject to change without notice and may differ or be contrary to opinions expressed by others.
Investments in securities involve the risk of loss.